The numpy.log() function is used to calculate the natural logarithm of the elements in an array.
Example
import numpy as np

# create a NumPy array
array1 = np.array([1, 2, 3, 4, 5])

# calculate the natural logarithm
# of each element in array1
result = np.log(array1)

print(result)

# Output: [0.         0.69314718 1.09861229 1.38629436 1.60943791]
log() Syntax
The syntax of the numpy.log() method is:
numpy.log(array)
log() Arguments
The numpy.log() method takes one argument:
array- the input array
log() Return Value
The numpy.log() method returns an array that contains the natural logarithm of the elements in the input array.
Example 1: Use of log() to Calculate Natural Logarithm
import numpy as np

# create a 2-D array
array1 = np.array([[0.5, 1.0, 2.0, 10.0],
                                [3.4, 1.5, 6.8, 4.12]])

# calculate the natural logarithm
# of each element in array1
result = np.log(array1)

print(result)
Output
[[-0.69314718  0.          0.69314718  2.30258509]
 [ 1.22377543  0.40546511  1.91692261  1.41585316]]
Here, we have used the np.log() method to calculate the natural logarithm of each element in the 2-D array named array1.
The resulting array result contains the natural logarithm values.
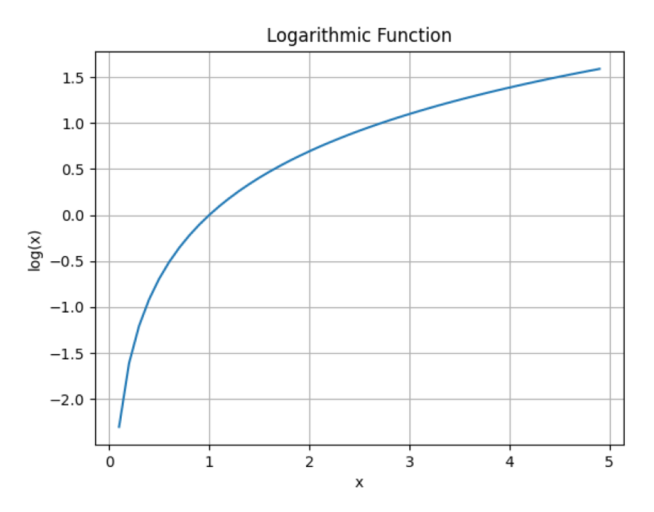
Example 2: Graphical Representation of log()
To provide a graphical representation of the logarithm function, let's plot the logarithm curve using matplotlib, a popular data visualization library in Python.
To use matplotlib, we'll first import it as plt.
import numpy as np
import matplotlib.pyplot as plt

# generate x values from 0.1 to 5 with a step of 0.1
x = np.arange(0.1, 5, 0.1)

# compute the logarithmic values of x
y = np.log(x)

# plot the logarithmic curve
plt.plot(x, y)
plt.xlabel('x')
plt.ylabel('log(x)')
plt.title('Logarithmic Function')
plt.grid(True)
plt.show()
Output

In the above example, we plot the x array on the x-axis and the y array, which contains the natural logarithm values, on the y-axis using plt.plot(x, y).